The decision to add capacity is part of your strategic decision making and business planning process. Growth alone is never a strategy, so it should be evaluated starting with the 8 questions at the end of the article.
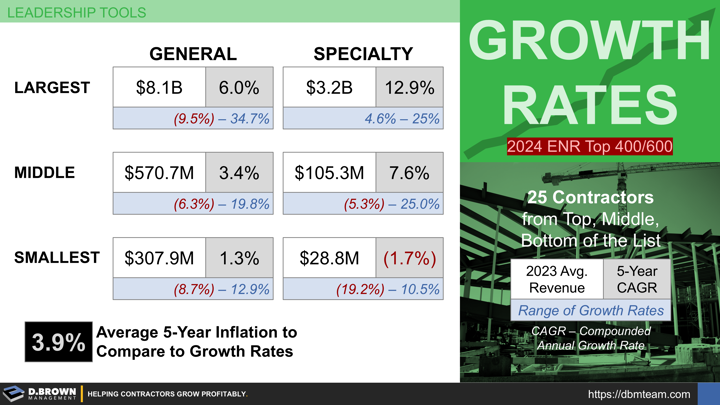
This is just summary level information taken from ENR Top Lists for General (top 400) and Specialty (top 600) Contractor rankings in 2024.
Notes About the Analysis
The 2024 rankings included total revenue for 2023.
We went back to the 2019 and 2014 rankings so we could get growth rates for the last 5 and 10 years.
Many contractors have merged, changed names, or were created as the result of multiple acquisitions such as ArchKey Solutions.
For the purposes of our analysis, we focused on averages of 25 contractors that had correlating data for all three timeframes.
We broke the analysis up into contractors at the top, the middle, and the bottom of the lists. Keep in mind that while the graphic says "Smallest," these are the smallest on the lists of the largest contractors in the United States.
There are about one million contractors in total, so the thousand contractors on these lists only represent 0.1% of all contractors.
When looking at growth rates, you have to put those in context of overall inflation rates. 5-year average inflation estimates ending 2023 were 3.9% and 10-year average inflation was 2.7%.
Stages of Growth
While not exact based on revenue, you can look at these three groups at different stages in the way we would define them:
Smallest: Averaging $29M for specialty and $308M for generals, these contractors are navigating growth from Stage 3 (Refinement) into Stage 4 (Scalable Foundation). The leadership focus is evolving to aligning people, processes, tools, and technology across the whole company to improve outcomes, scalability, and resiliency.
Middle: Averaging $105M for specialty and $571M for generals, these organizational structures are 2-3X larger and likely spread out a lot more geographically. They are moving into Stage 5 (Ready to Scale). The leaders are focused on aligning the team around common vision, values, and the long-term strategies required for sustainable growth including succession. They are also systematizing the talent pipeline for key functions.
Largest: Averaging $3.2B for specialty and $8.1B for generals, these contractors are all working at Stages 6+ which is where scaling and succession become sustainable systems. The leadership focus at this stage is about sustaining the business, including governance, strategy, succession, and scalability for all economic conditions. Strategy, planning, risk, and succession at all levels are becoming more systematic rather than task-oriented. When contractors at this stage stumble, it is typically because they've lost what Bain & Company call "Founder's Mentality."
General Contractors - Quick Growth Metrics
- The largest 25 that had correlations to all lists averaged $8.1B in revenue. Their Compounded Annual Growth Rate (CAGR) during the last five years (2018-2023) was 6% and over the last 10 years (2013-2023) averaged 3%. The range on the 5-year growth was from (-9.5%) to 34.7%.
- The next largest 25 starting at 2024 ranking of 51 averaged $1.9B or just 25% the size of the largest. Their five- and ten-year CAGR was 10.6% and 5.2% respectively with the range for 5-year annual growth rates being 2.5% at the lowest up to 27.2% at the highest.
- The middle 25 starting at the 2024 ranking of 201 averaged $571M in revenue growing an average of 3.4% since 2018 and 1.7% since 2013. Their 5-year CAGR ranged from (-6.3%) to 19.8%.
- The smallest 25 on the list averaged $308M in revenue growing an average of 1.3% since 2018 and 0.7% since 2013. Their 5-year CAGR ranged from (-8.7%) to 12.9%.
- Notice that on average, the last two groups from the list didn't even keep up with inflation which averaged 3.9% during the last five years and 2.7% during the last ten. This is an indication of just how challenging growth and succession are in the construction industry.
Specialty Contractors - Quick Growth Metrics
This list was broken down into six groups because there is a lot more diversity in specialty contractors, which is why the list is longer with 600 contractors listed. Each group is the average of the 25 contractors that had data correlating to prior years.
- Largest (First 25): $3.2B in revenue with 5-Year CAGR of 12.9% and 10-year of 11.2%. Range on 5-year CAGR 4.6% to 25%.
- Large (First 25 after #50): $611M in revenue with 5-Year CAGR of 12.2% and 10-year of 10.4%. Range on 5-year CAGR 1.5% to 32.6%.
- Mid-High (First 25 after #200): $191M in revenue with 5-Year CAGR of 10.1% and 10-year of 8.5%. Range on 5-year CAGR 0.5% to 35.9%.
- Middle (First 25 after #300): $105M in revenue with 5-Year CAGR of 7.6% and 10-year of 8.0%. Range on 5-year CAGR (-5.3)% to 25.0%.
- Mid-Low (First 25 after #400): $61M in revenue with 5-Year CAGR of 2.9% and 10-year of 5.0%. Range on 5-year CAGR (-9.0)% to 14.7%.
- Smallest (Last 25): $29M in revenue with 5-Year CAGR of (-1.7%) and 10-year of 1.8%. Range on 5-year CAGR (-19.2)% to 10.5%.
The smaller contractors on this list also had difficulty keeping up with inflation. This is a great indicator of just how difficult the transition from Stage 3 to Stage 4 is.
Learn More
Look at your company's growth as compared to industry benchmarks for financial performance.
Every contractor grows through six general stages with each requiring different strategies, systems, structure, and leadership focus. This 90-minute discussion covers the basic challenges with examples for all levels. Includes dozens of additional resources and tools.

