Change Management Dashboards

Summarize your detailed change tracking logs with concise dashboards.

D. Brown Management Profile Picture
Share

These concise dashboards give you critical information in a format that allows you to see the big picture while still having enough information to be actionable.

Change Management: Dashboards for Effective Management. Aging of change order status codes and summary of aging by project manager.

Consider two very simple views of changes:

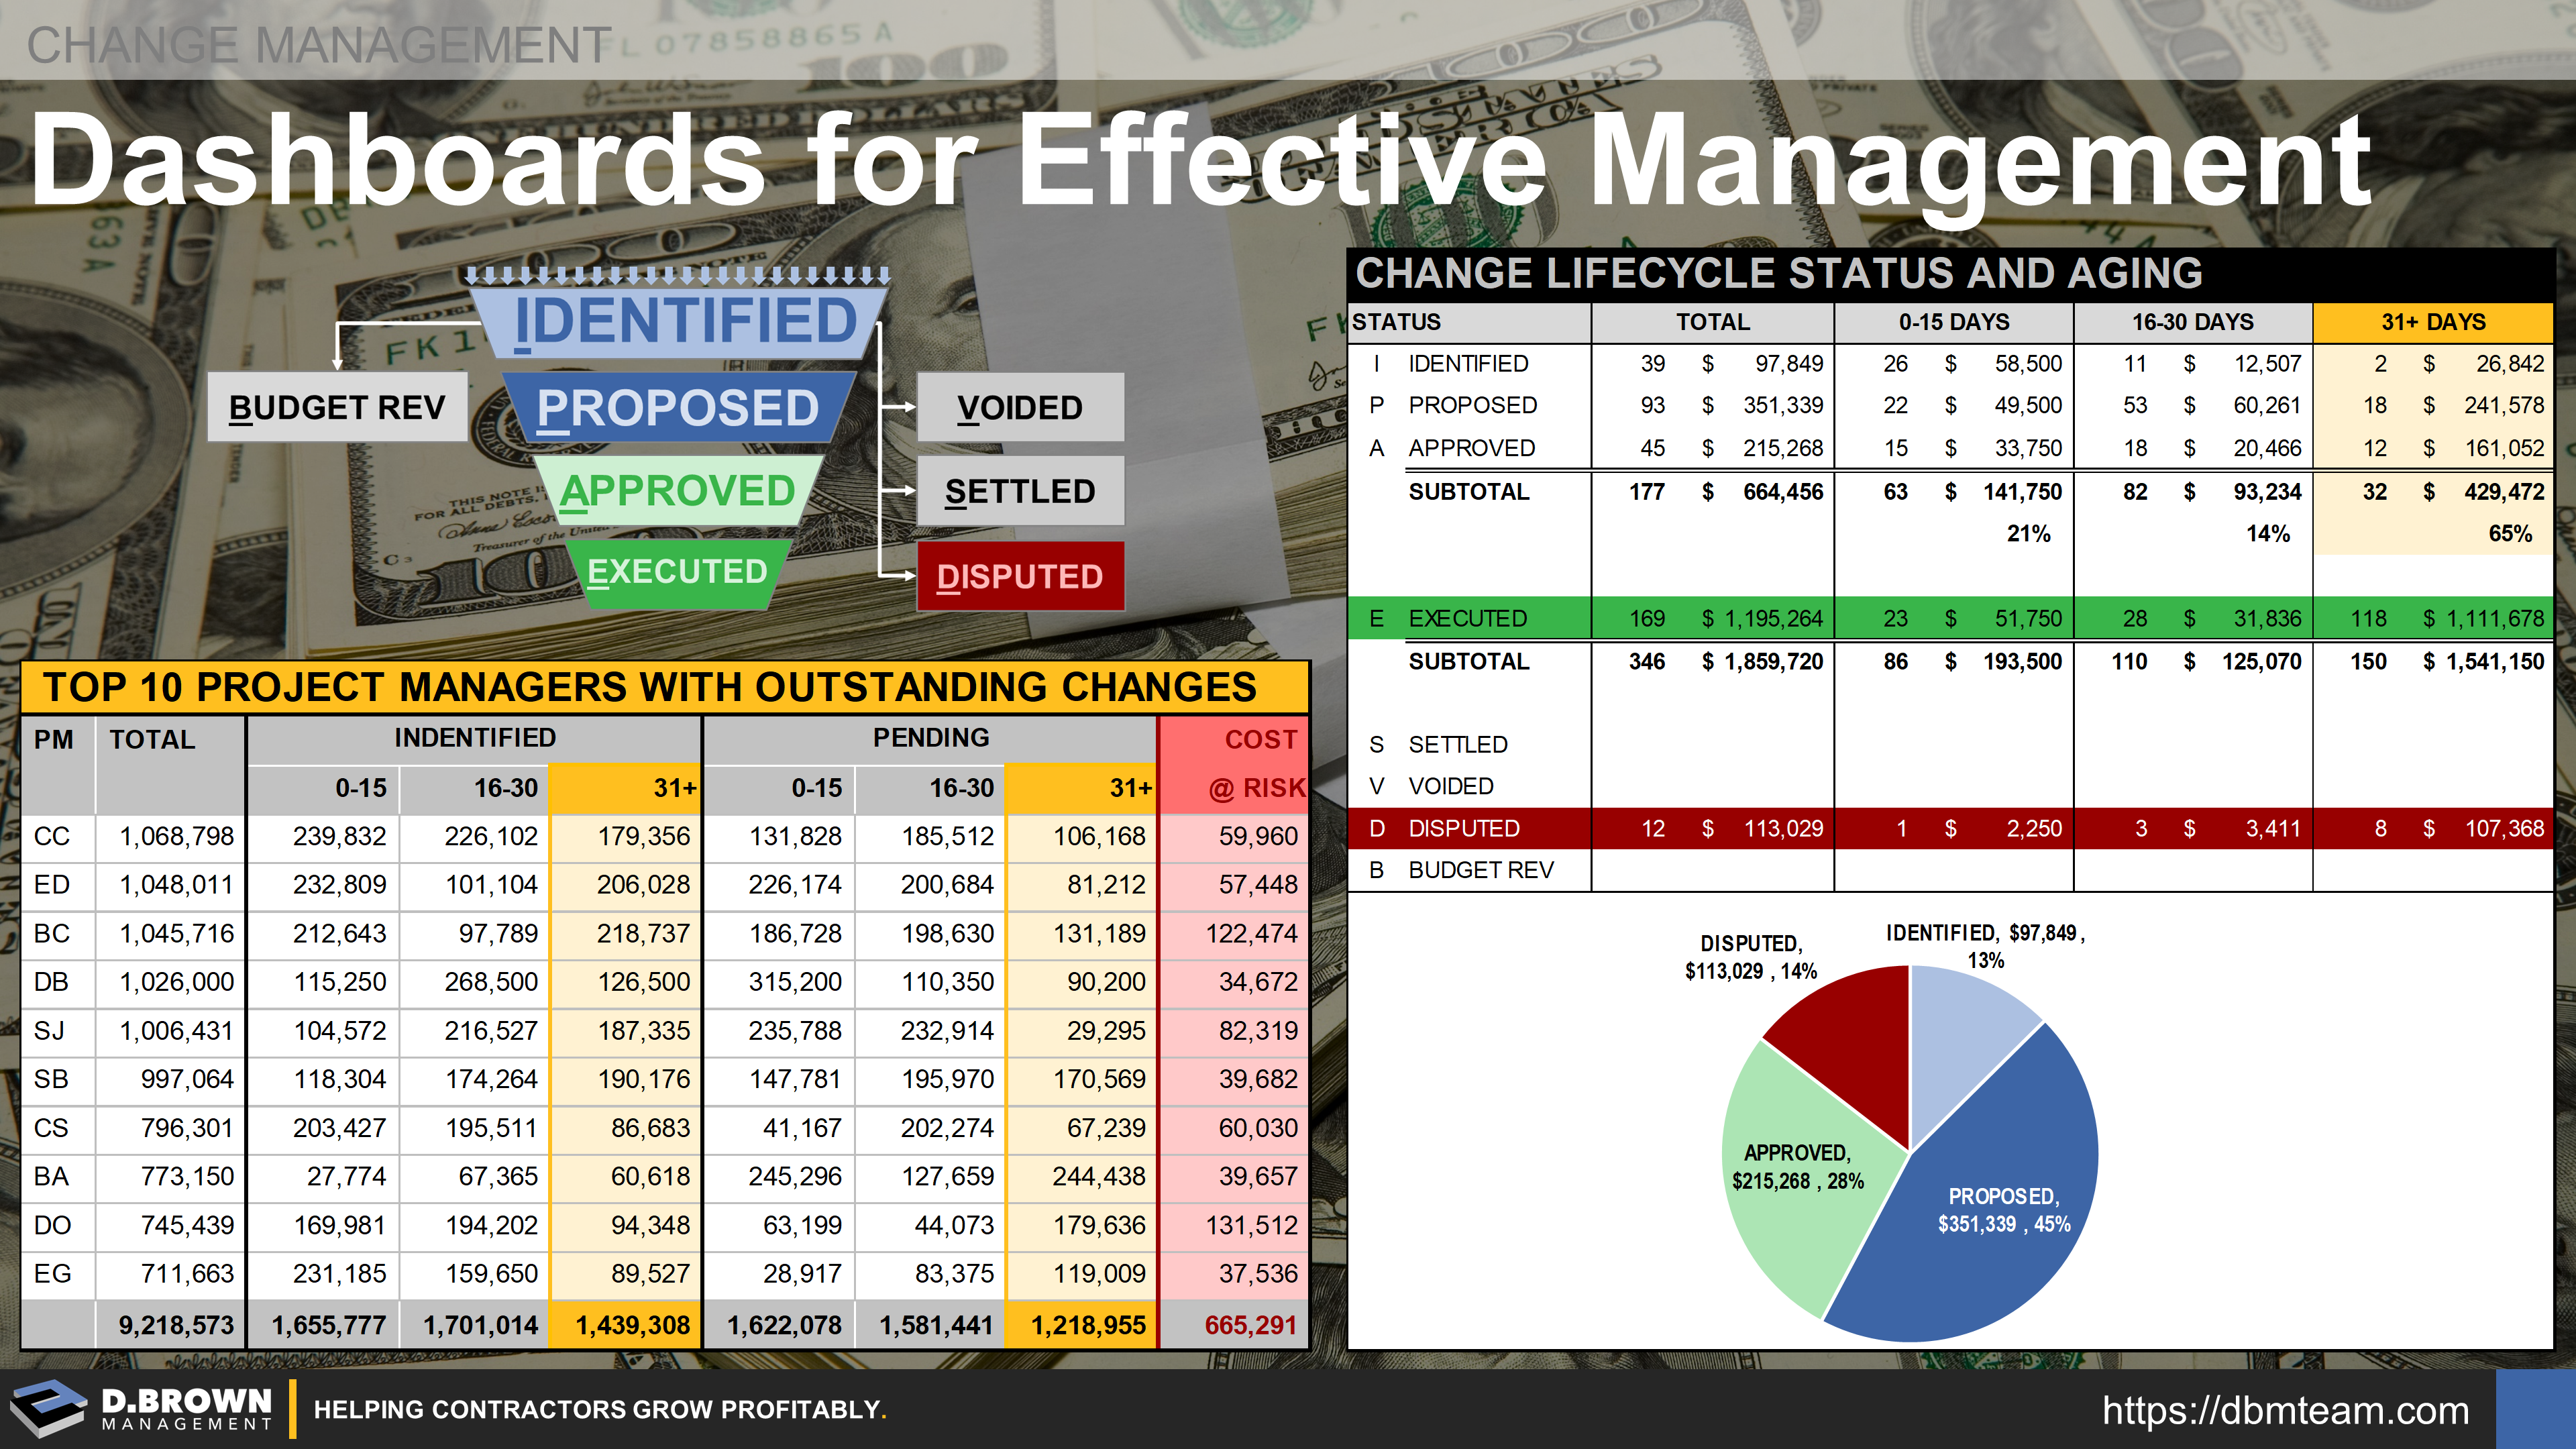
  • One page aging summary by stage of change, including quantities and amounts in each aging bucket. This format can summarize a single project, PM, business unit, or company. Showing a pie chart of the unexecuted changes that are in progress can let you quickly see your opportunities and risks.  

  • A simple matrix that summarizes each PM and the aging of identified changes that have not been proposed to the customer, as well as changes that have been proposed but are pending approval from the customer. These are the two most critical stages to monitor. Rigorous change management meetings held 2X monthly will improve these metrics.  

It is very easy for a contractor to get into a cash flow crunch through a combination of slow change order processing and growing retention.  

Learn more about how we help contractors improve change management through people, process, training, and tools.  


Change Management Dashboards
Change orders are a fact of life in construction. Improve profitability, cash flow and customer satisfaction by effectively managing changes. Build a foundation for success with 12 steps to improve pricing and 11 negotiating strategies for the whole project team....

Related Training
Change Management Dashboards
Change orders are a fact of life in construction. Improve profitability, cash flow and customer satisfaction by effectively managing changes. Build a foundation for success with 12 steps to improve pricing and 11 negotiating strategies for the whole project team....

Rockstars, M&M's, Safety, and Contractor Growth
As projects and contractors grow in size and complexity, it is impossible for leaders to be everywhere and see everything, yet they are 100% accountable for the outcomes. Leverage simple indicators like a rockstar to quickly identify areas of concern.
Production Tracking - The Basics
Schedule + Production are two foundational key results the Foreman will achieve through their planning. The heart of any production measurement is simply “Earned Budget vs. Actual Cost”.
Problem-Resolution Cost Pyramid - Earlier is Always Better
An easy way to visualize the cost of problem resolution at different stages of construction is with this pyramid. The cost of the problem is the cost of the problem (1X). Finding it ahead of time minimizes the costs and maximizes customer satisfaction.