Over and Under Billing Metric Trend

Contractors looking for key metrics to manage should be focused on Outcomes or Key Results, and Lead Measures or Leading Activities.

D. Brown Management Profile Picture
Share


Cash Flow: Over / (Under) Billing Trend.
  • OUTCOMES: Or Key Results. What metric(s) will best show the final state you want to be in AND progress toward that target level of performance?
  • LEAD MEASURES: Or Leading Activities that will most likely lead to the Key Results or Outcomes you want. The metrics that measure the Leading Activities are typically at a more rapid cycle time than the outcome based metric.  

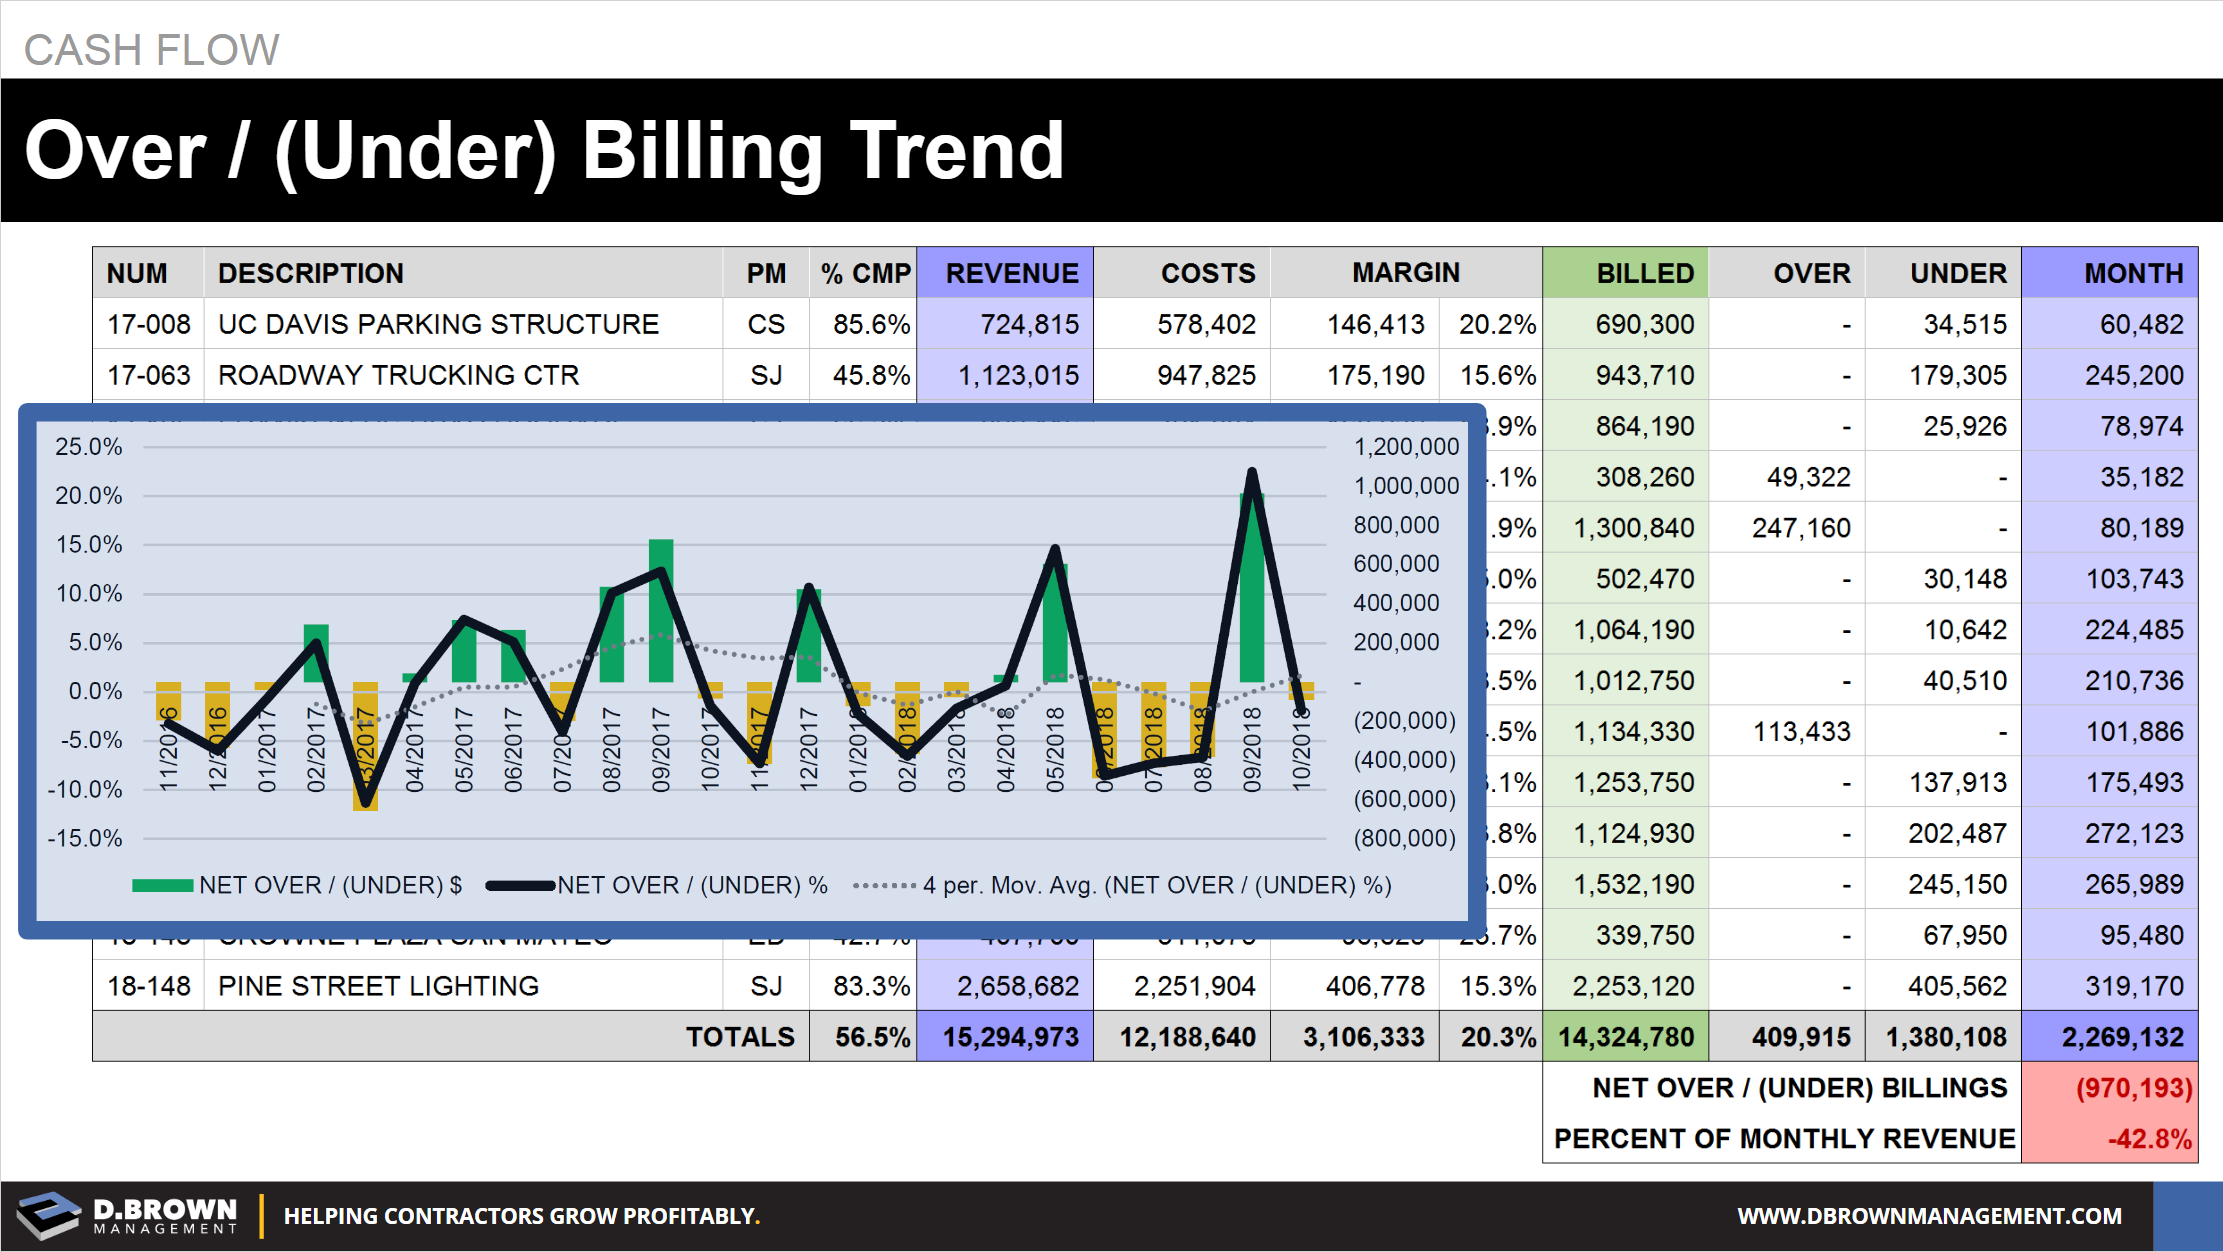
At the cash flow level, if you want to improve your Cash Metric to 100% or better, the first activity that must be controlled is the monthly billing performance of the projects.  

No amount of excellence in collections will help you get close to 100% if you are continuously under-billed on your Work-in-Progress (WIP) as a whole.

Metrics alone WILL NOT change your outcomes; they will simply let you know the score. The most important aspect of this is the regular Operating Rhythm that reinforces a rigorous PDCA cycle each period, similar to what the Last Planner System does at the project level.


Over and Under Billing Metric Trend
Great cash flow is a key driver of valuation and successful successions. Running out of cash is is the #1 reason contractors fail. Improving cash flow improves your Return on Equity. Protect yourself and never let cash flow be the limitation to your profitable growth....

Opportunity Pipeline Target Size: The Basic Math
The biggest leading indicator for performance of a contractor is the size, quality, and trajectory of their opportunity pipeline. There are lots of nuances and complexity to evaluating your pipeline, but it all starts with the principles and basic math.
Percent Planned Complete (PPC) - Calculation Example
Yoda would be the perfect coach for managing schedules on projects: “Do or do not. There is no try.” This is the heart of Percent Planned Complete (PPC) and the weekly cycle of continuous production improvement.
Issue 9 of 9: Low Barriers to Entry
Construction Ownership Transition Issue 9 of 9: There are Few Barriers to Entry for New Contractors. About 500 construction contractors start up each day. In most cases, a new contractor starting up will cause a serious talent drain and add competition.