When you are looking at your scoreboard, remember that industry average benchmarks and single points in time only tell part of the story.
Just like physical training, what really matters for your personal health is that you are consistently improving.
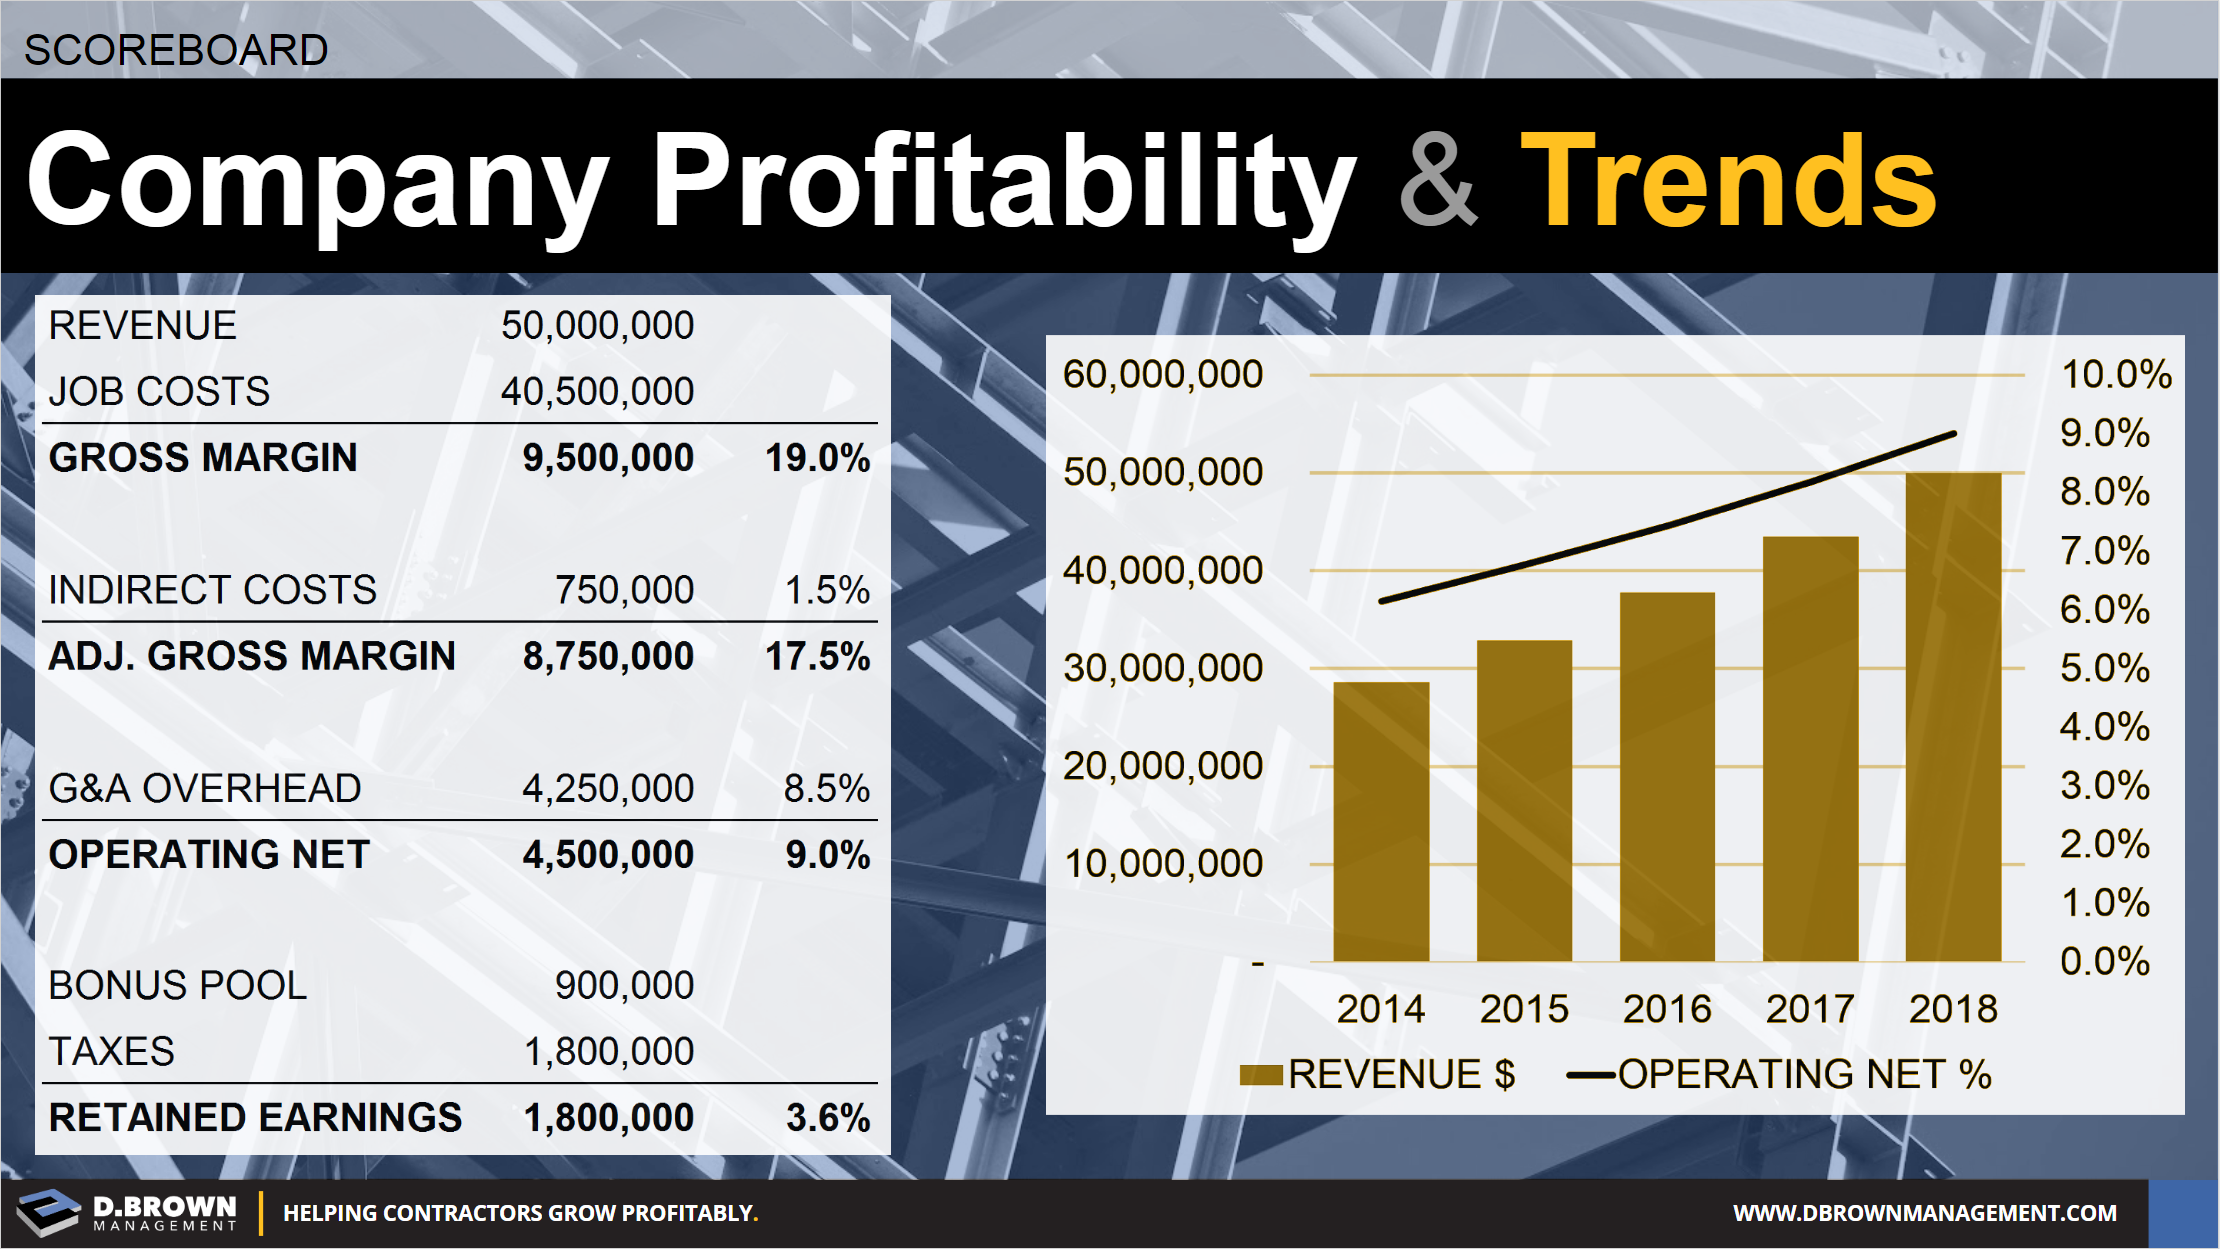
- Graph your key metrics over the last five years and look for relationships.
- Analyze your data and look for outliers to help the trends make more sense. For example, did you have one super good or bad job in a year that completely skewed the metrics?
- Be cautious not to over-rationalize “outliers.” If you have a bad job every year, remember that is more likely to be part of the trend rather than due to an outlier. For example, Motorola had something like 24 consecutive quarters of “one-time” expenses. If they occur that consistently, they are regular expenses and not one-time expenses. Also, Motorola is no longer around.
- What do those metric trends look like if you project them another 2-3 years into the future?
- Which metrics are trending in the right direction?
- Which metrics can you improve? How?
Want to talk about it? Contact us for a conversation.